Final Portfolio Reflection
April 28, 2017
Writing for this class has been a strange mix of what appeared to be some of the simplest and some of the most complex writing I have ever been asked to produce. When I think of complex, detail-oriented writing, literary analysis comes first to mind, while reflective writing holds a more care-free personality. This course, in which I was given more reflective assignments than I care to remember, did its best to convince me otherwise. Here, reflective writing was a puzzle, requiring careful insight and organization. No longer was it acceptable for me to sit down and start writing; instead, I needed to first think of questions that might guide my writing, then answers that could provide content, before I could finally begin to fit those pieces together into a coherent product. I don’t think my reflective writing has magically transformed into some sort of well-oiled machine, but my approach to writing has become more detail-oriented. More transitory than my writing was my willingness to take on different challenges and explore, which grew from a heavy reluctance to an open curiosity as the semester charged forward. From the content of my writing to the medium in which it was presented, this course challenged me to consider what I really wanted to say and how to use the technology available to present it in the best way possible.
My most introspective writing came in the form of my Technology Literacy Narrative. Comprised of two parts, the past and the present, this narrative demanded that I reflect not only on my own writing, but on my own actions. For these assignments, the questions meant to guide the writing did just that, as these pages began simply as freely written responses to these questions that I then coordinated into a more organized piece. The written flow of this early writing was a bit choppy at moments, such as when I transitioned to begin talking about social media usage. After speaking primarily about my computer initiation through computer games, I quickly shifted to explain that “my first experience with social networking sites was on Gmail.” The transition survives in the context of the essay, but this is an instance where I think I prioritized my responses to the prompts rather than allowing the narrative to develop of its own accord.
I’m not entirely hopeless when it comes to using a computer.
The ‘past’ essay also offers some insight into my reluctance to branch out of from the familiar. Describing myself as “not entirely hopeless when it comes to using a computer,” it’s safe to say that I haven’t always been super confident in my tech skills. This is still true, but I think I have progressed away from the “mystique and fear” associated with skills like coding.
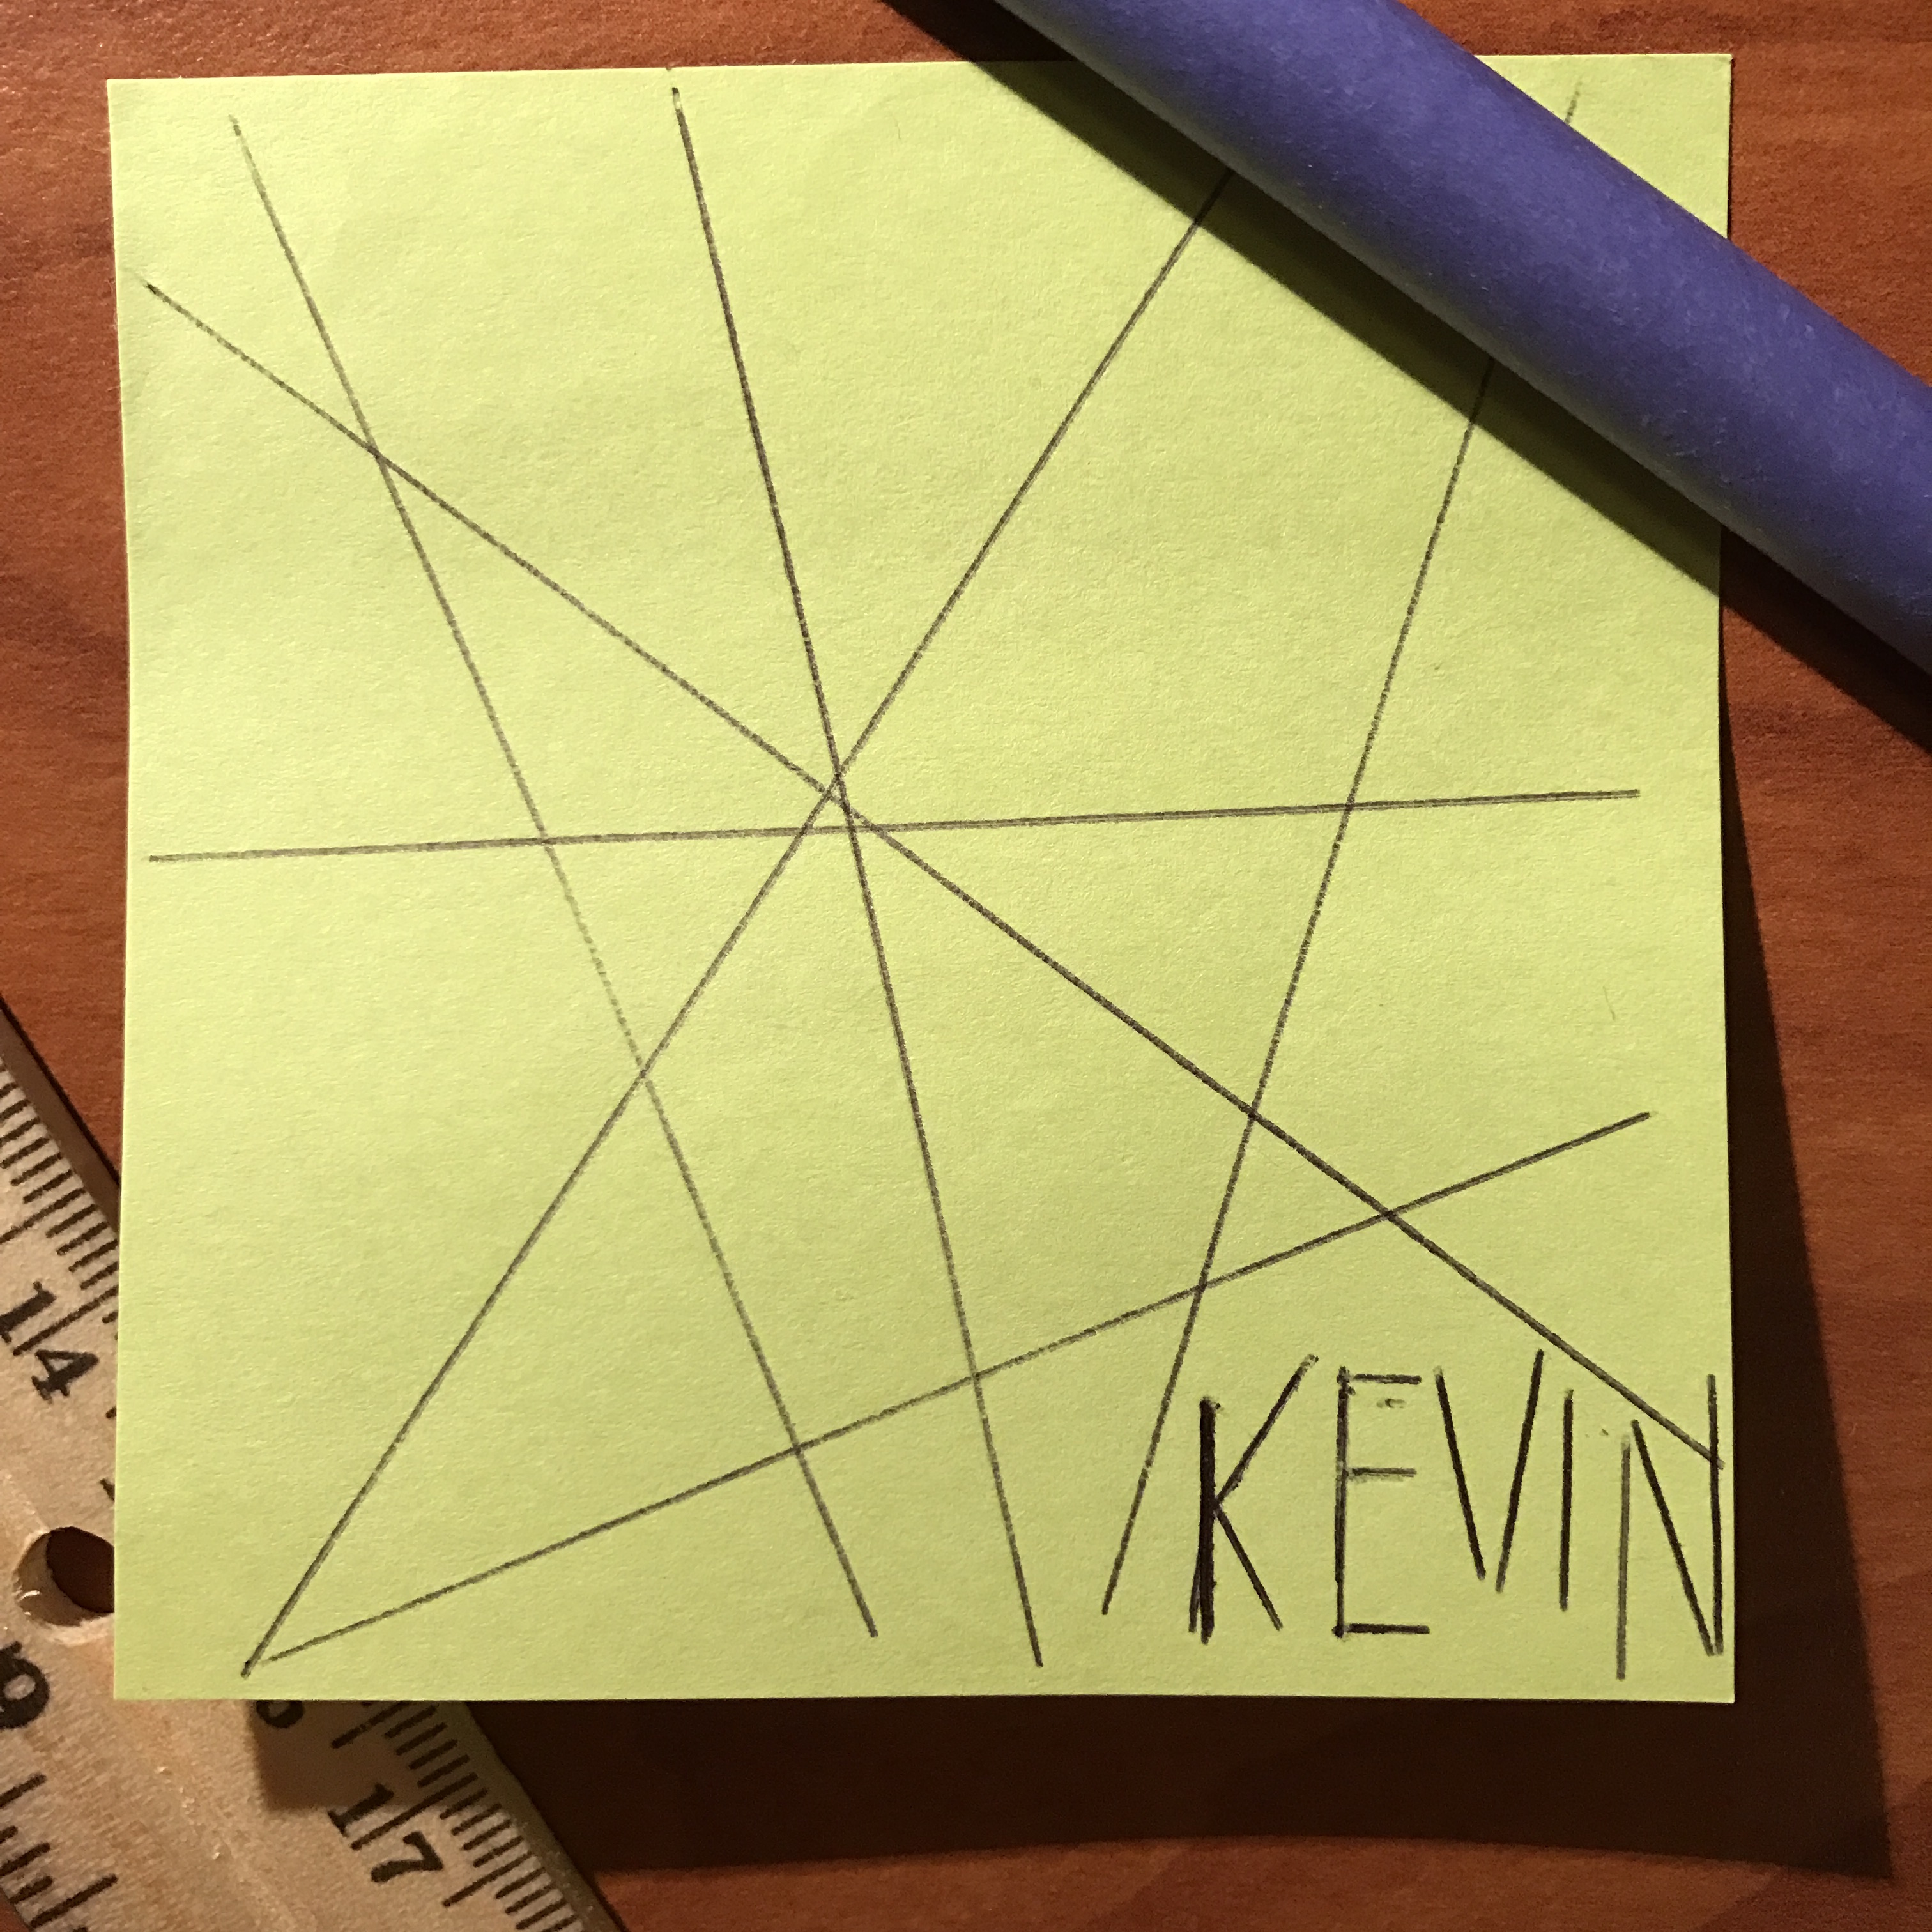
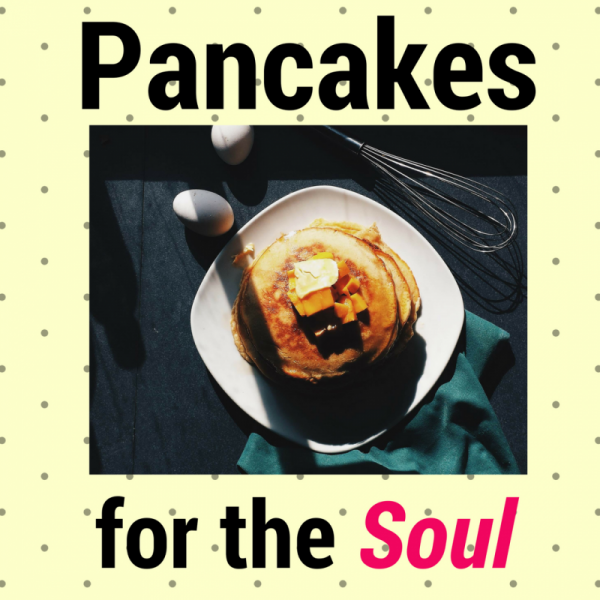
Looking at the progression from the sketches to the data visualization assignment, there is a definite change in my approach to how best to tackle these tasks. The avatar, our first post, offers a prime example of my starting mindset. With the proclamation that the medium of the art was “pen on sticky note,” I set a rather traditionalist tone given the course’s focus on new media. That tone solidified even more with my proposed podcast image, which I made using cut out newspaper clips. I’m not sure you can get much more old media than that. Changes began to occur around the time I created the image for the SoulPancake podcast, an image I developed with Canva. Editing images with software is a practice I have always avoided, mainly because the task seemed above my knowledge curve when it came to computer navigation. Even in my 'present' narrative, I found time to note just how much I “hate Photoshop, even though I don’t think I’ve actually used it since sixth grade.” Making the images by hand and photographing them just seemed like a more efficient and effective production process. A few classmates mentioned using Canva for the potential podcast image, so I decided to at least give it a look. Shockingly, it was pretty easy to navigate, so I went ahead and used it to make the image for the “Pancakes for the Soul” episode. This was my first step forward.
Where I really made strides was with the data visualization assignment. For this project, we wanted to implement a software program called Tableau. The class session in which it was introduced deserves a lot of credit for my willingness to delve deeper. I honestly may not have even downloaded the software if we hadn’t practiced in class. The fact that most people in the class were starting fresh was also encouraging – I didn’t feel as though I had to do a lot of catching up just to get by. Tableau seemed like it could be a fun tool, so I decided I might as well test its limits. During a canceled class period, I took a little time just to throw some data around and see what it would do, and began to get a better understanding of how to use the software. I ended up making the tables/charts for our group’s web page, but there was still one more problem to be solved.
The most intriguing element of Tableau is that the tables are responsive and interactive. Hover the mouse over a bar and it will tell you what it represents. Thus it seemed important that, if we used Tableau, we make sure that the tables we made be interactive in our final product, otherwise we wouldn’t have created anything that could do much more than any ordinary excel chart may have been able to accomplish. Embedding those tables into a post was easier said than done. We at first were content to download images of the tables and place them in as pictures, but I did a bit of digging and ultimately found a way to place the tabls into our post in their interactive state.
I don’t think I would have felt confident enough in my computer abilities at the start of the semester to tackle this problem. A lot of credit has to go to George Pullman, because the minor practices we did with coding in Writing Online: Rhetoric for the Digital Age (I made a table at one point!) gave me the background knowledge I needed to take the code for the tables and place it into the text box for our page. Although it seemed a little iffy at the time, the data visualization assignment was a great final project because it gave me an opportunity to test and see what I was capable of creating.
| Team | Record | SOS | BPI | RPI |
|---|---|---|---|---|
| KU | 28-3 | 35 | 10 | 3 |
| Nova | 31-3 | 37 | 1 | 1 |
| Arizona | 30-4 | 24 | 24 | 2 |
I coded (coded?) this table!
Computers were expensive and complex, and I hardly dared to push beyond the safe boundaries of the familiar.
In the ‘present’ narrative, I talk a bit about how my current tendencies with technology stem from a belief that computers are “not designed for creation or exploration,” but rather prefer to “[fight] against users … computers were expensive and complex, and I hardly dared to push beyond the safe boundaries of the familiar.” When I typed out these thoughts just a couple months ago, they weren’t intended to be discouraging — this was just reality. Already, I read those thoughts again and I realize that this insight should have been a bit concerning. If I didn’t push the limits of what I already knew, I wouldn’t have been able to produce anything nearly as cool as our data visualization page, not would I have been able to enjoy the pride that came with it. When I wrote the piece, I was well aware of how “narrow minded [I am] when it comes to what I believe I am capable of accomplishing on a computer, and I hope to break out of that mindset.” I have made progress on this hope, but I couldn’t fully bracket out the present tense in that sentence because I know I am not yet where I could be in terms of computer literacy. For now, I can take a satisfied breath that, at this new present, I feel much more confident in my ability to achieve those goals and participate as an online creator.